Measure where you stand. Chart the path to where you want to be.

Data Delight is an Australian data and AI consultancy for education. We help ministries, school systems and their technology partners understand where they stand with data and AI, and build a sequenced path forward. Since January 2024 we have worked as data and AI consultant to Google for Education.

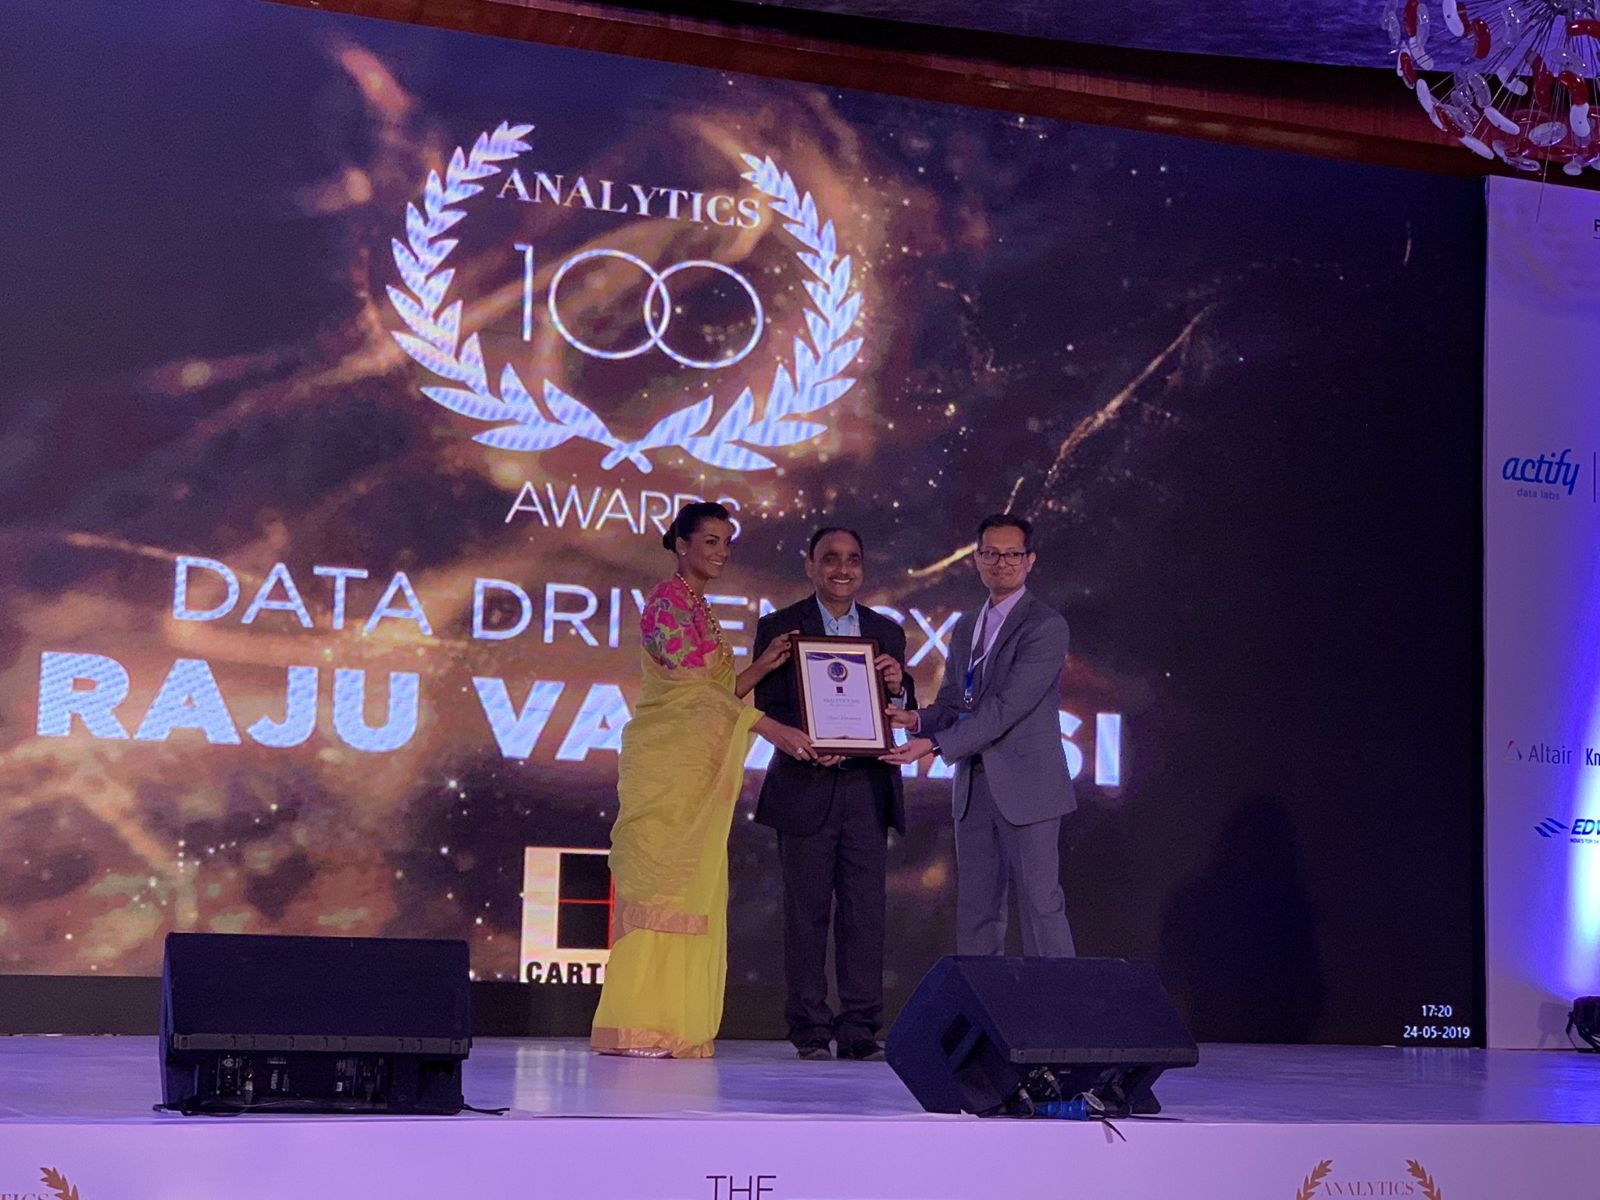
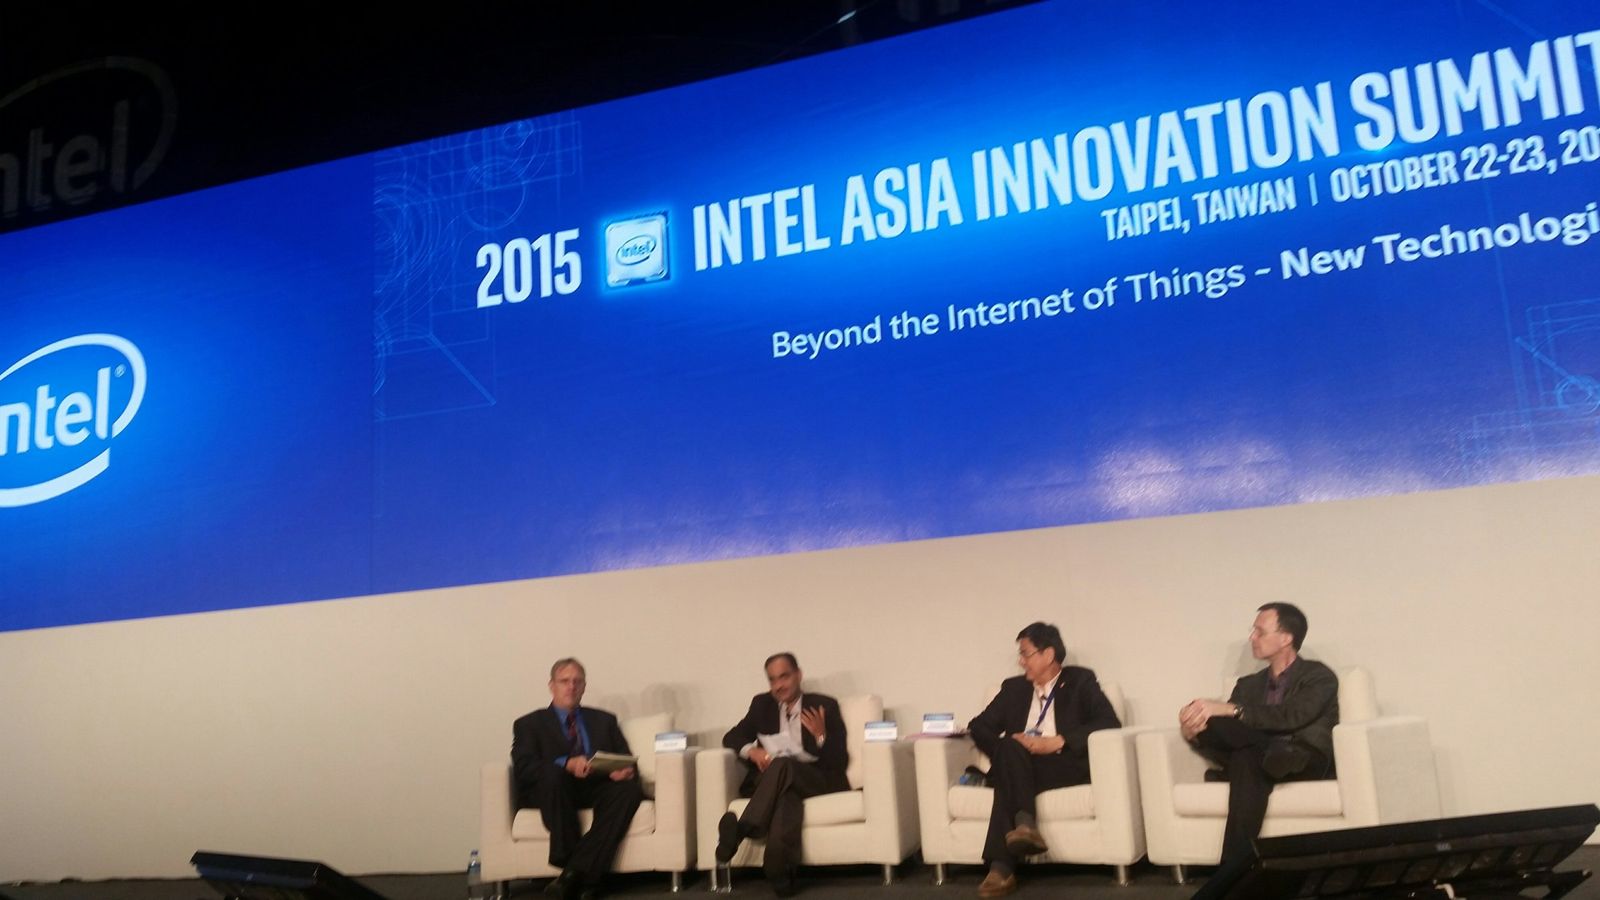
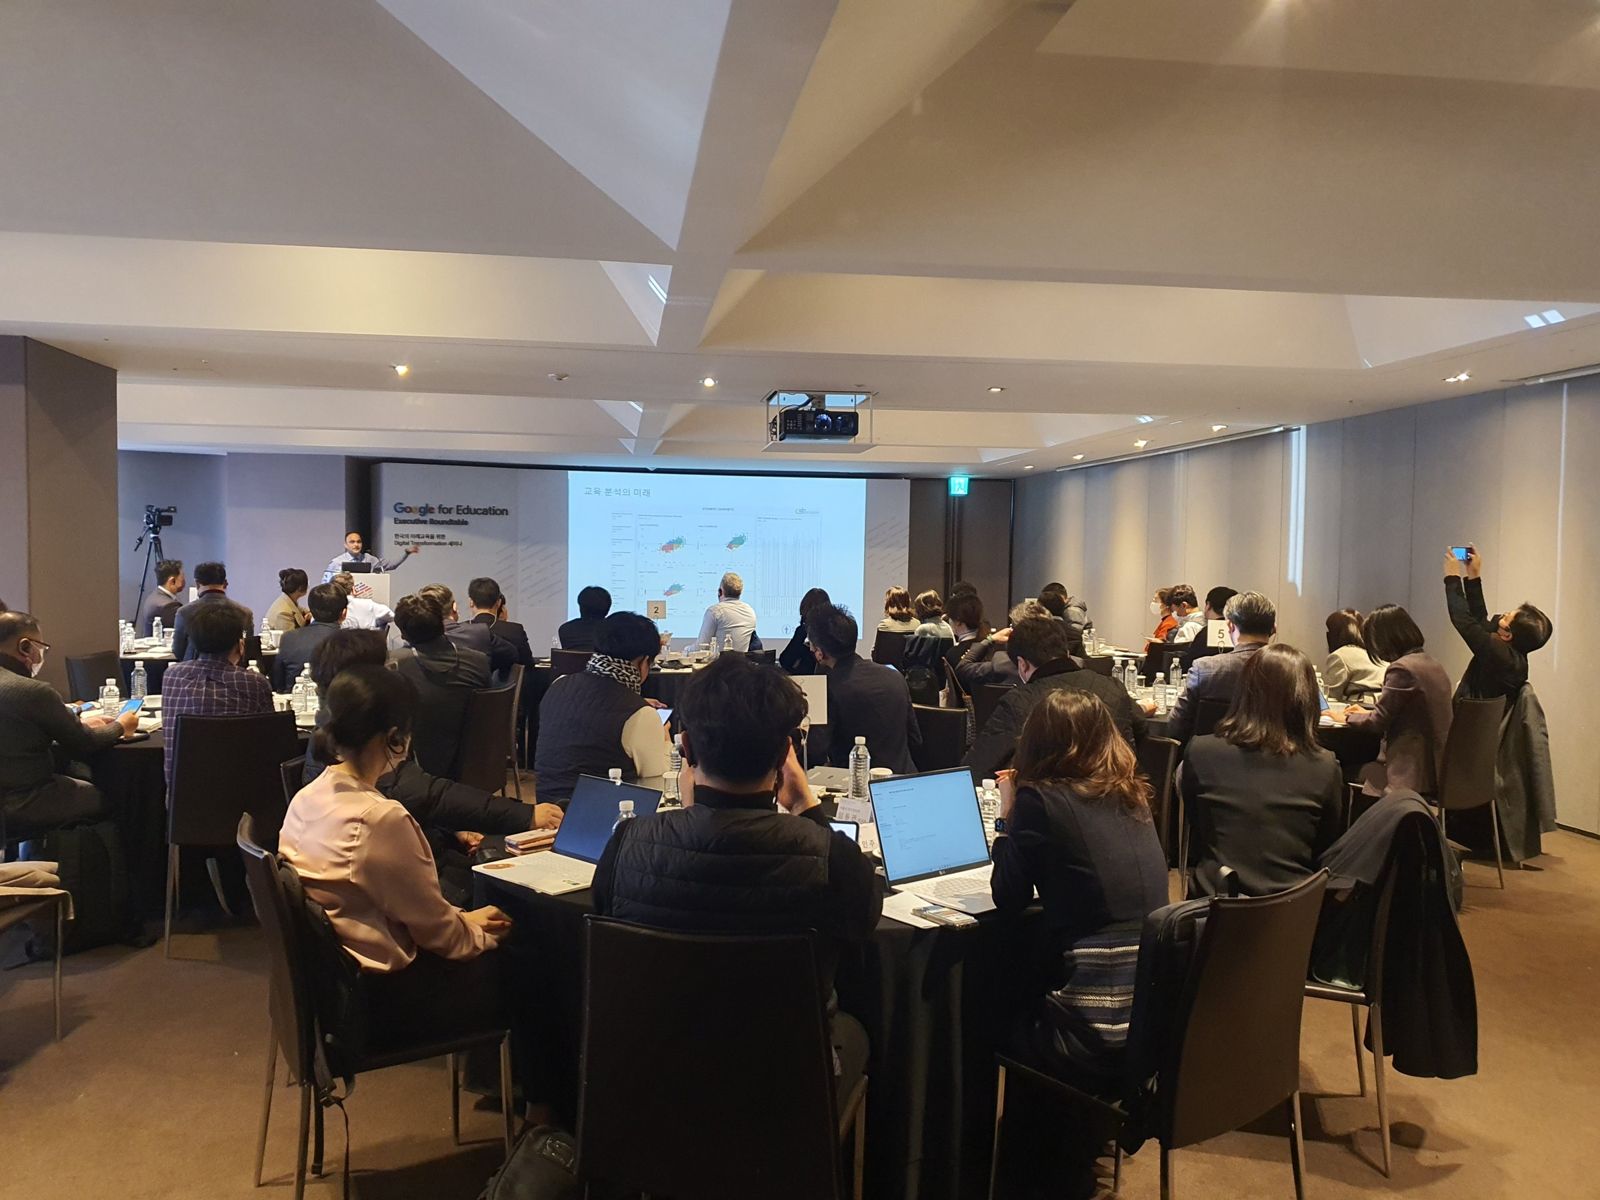
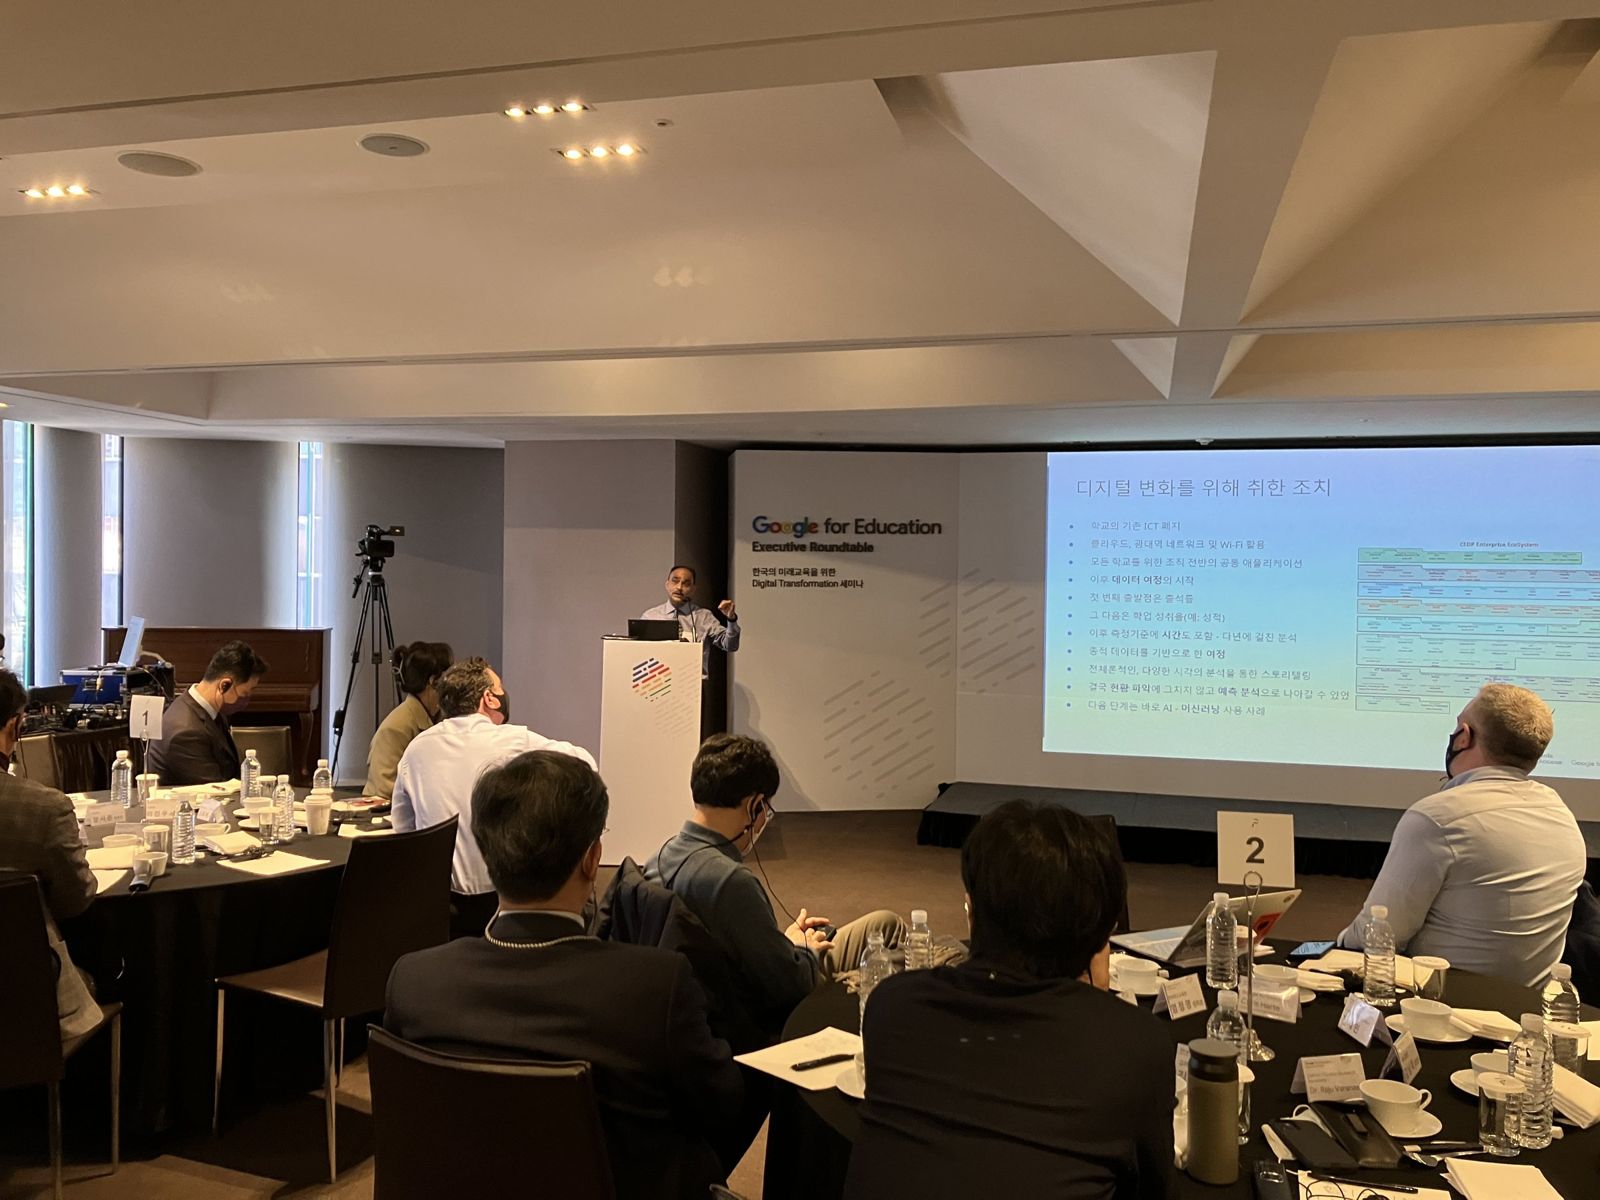
Dr. Raju Varanasi presenting to education leaders

The Education Intelligence Suite.

Six service packages that show an education system where it stands and what to do next.

Advisory.

Strategy, roadmaps and evidence for ministries planning digital transformation.

Data and AI delivery.

Data platforms, dashboards and AI prototypes built for education.

Education Intelligence Suite

Six service packages for education systems. Each one stands alone, and together they build a complete picture: how ready the system's data is, how its schools are progressing, whether its partners can deliver, and how it keeps what it knows.

How every engagement runs

  1. Spark. A 90-minute workshop that frames the question with leaders.

  2. Assess. A discovery workshop and a facilitated self-assessment.

  3. Transform. A roadmap and report the system can act on.

Assessment frameworks

Data, Analytics & AI Maturity Model

A facilitated assessment of data and AI readiness across five dimensions: strategy and governance, data management, analytics and technology, people and culture, and responsible AI and risk. It places a system on six stages, from siloed data foundations to an adaptive autonomous enterprise, and shows the findings through four lenses: ministers and policymakers, executives, CIO / CDAO, and technical delivery teams.

six stages

five dimensions

four lenses

School Progress Framework

A 36-question self-assessment that helps schools see their own progress across three domains, Flourishing, Leading and Learning, and four non-linear states: Evolving, Connecting, Thriving and Sustaining. Each school is measured against its own baseline, never ranked against others. The framework has been tested across a school system.

four non-linear states

three domains

36-question · own baseline

Assessment frameworks

Partner Development Model

A structured way to assess and develop the technology partners who deliver education programmes, so systems know which partners can deliver and how to help them grow.

Data service

Data Evangelists for Google Data Commons

We help ministries and research bodies use Google Data Commons, open and internationally benchmarked public data, to answer policy questions: use cases, proof-of-concept dashboards and in-house champions.

Emerging services

Professional Legacy Intelligence

An AI-indexed personal archive and transition briefing that keeps a senior leader's knowledge available after they move on.

Emerging services

Institutional Knowledge Commons

An organisation-wide, queryable archive and knowledge graph, so a ministry keeps its institutional memory through leadership changes.

Not sure where to start? Book a 30-minute discovery call.

Services

Education system advisory

Advice to ministries on digital transformation strategy, roadmaps, monitoring and evaluation, and international evidence.

Data platforms and analytics

Data profiling and cleaning, BigQuery data warehouses, and decision dashboards in Looker for school and system leaders.

Agentic AI prototyping

Curriculum-grounded AI agents built on Google's agent tools and Gemini, with offline versions for low-connectivity settings.

Interactive self-assessment tools

We turn research frameworks into secure web tools with charts, tiered reports, side-by-side stakeholder comparison and PDF export.

Case studies

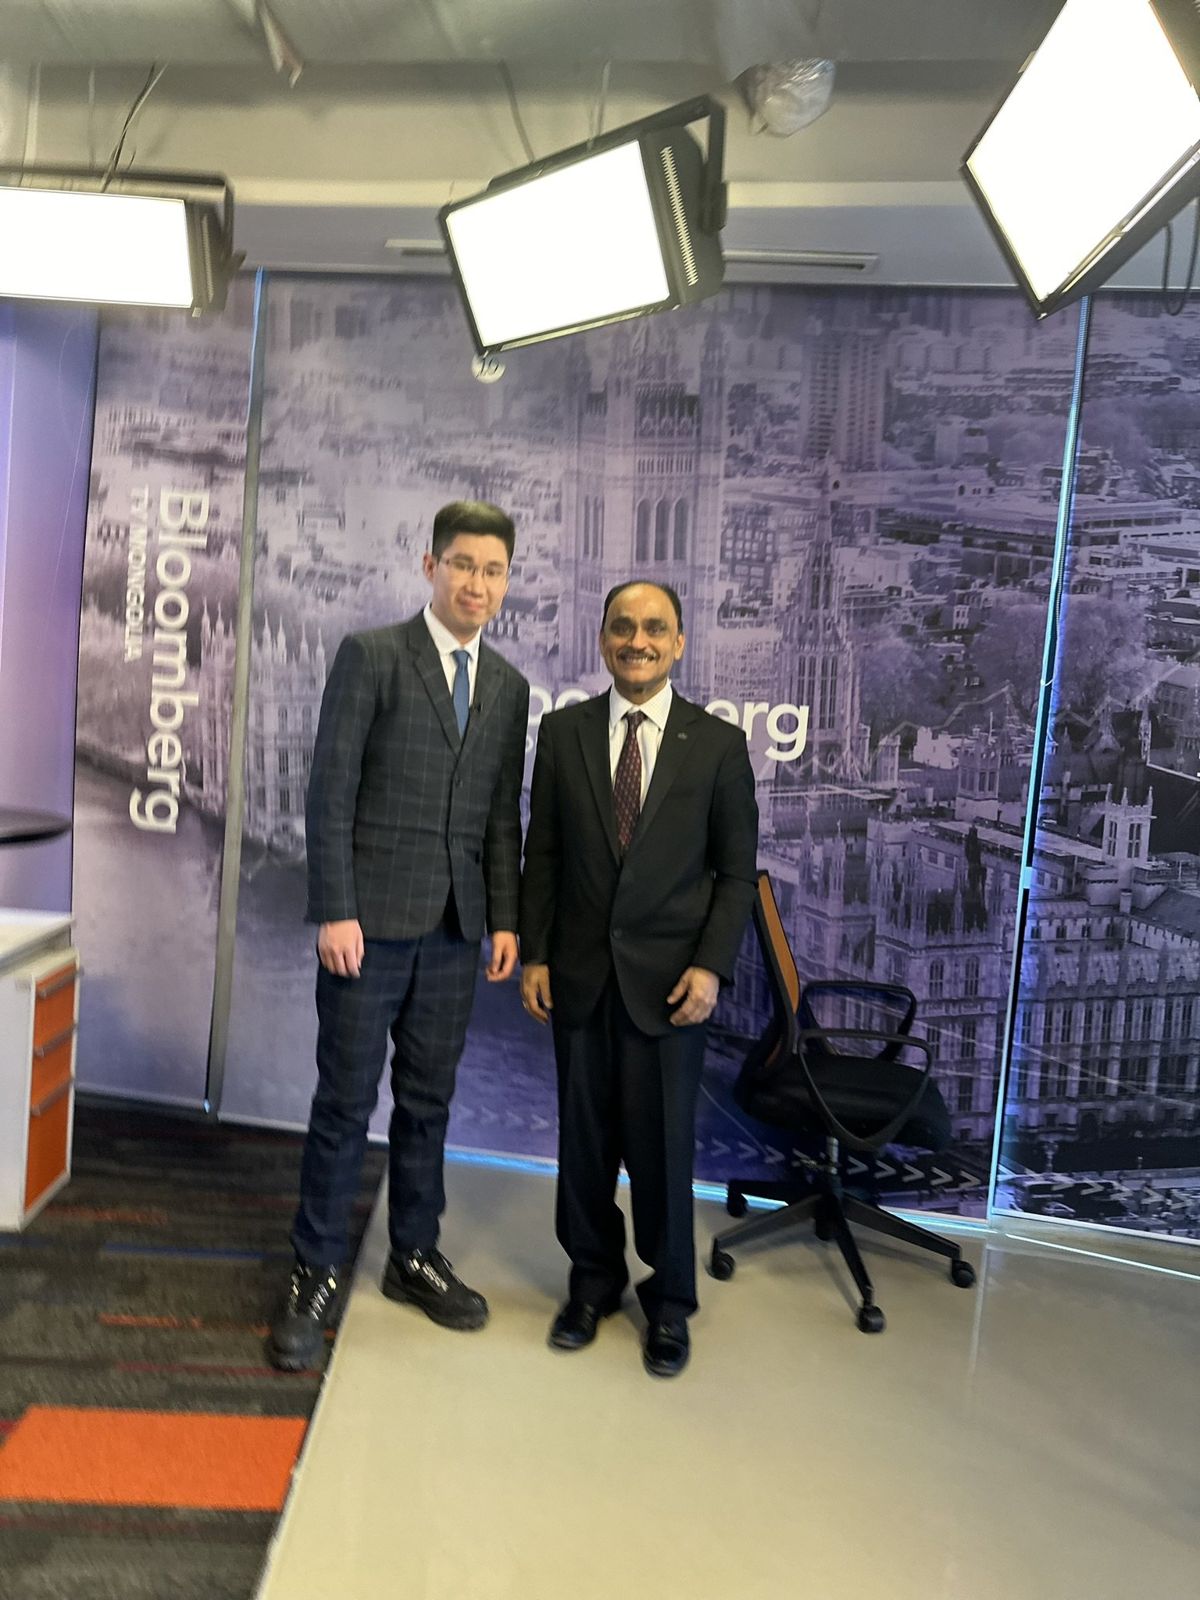
Building Mongolia's national education data foundation

Client
Ministry of Education and Science of Mongolia, with Dr. Raju Varanasi as Project Advisor. Built on Google Cloud.
Challenge
Mongolia's school system spans 876 schools and more than 37,000 teachers. More than 25 education applications and two data centres were generating data, but it sat in silos, so leaders could not see the system as a whole.
What we did
A four-week ICT health check across infrastructure, networking, cloud adoption, data governance, application performance and cybersecurity set the roadmap. A Center for Analytics and AI brought the key education agencies together, and data from Google Workspace and other systems was integrated into a single BigQuery data lake with Looker Studio dashboards.
Outcome
Within two months, priority use cases were defined and the data pipelines were running. The dashboards challenged long-held assumptions: teacher movement to private schools turned out to be modest, while the real issues were qualified graduates not entering teaching and early-career teachers leaving. Teacher shortages proved similar across provinces rather than concentrated in the cities.
Next
Broader analytics use cases, AI teacher assistants on Google Cloud, and the School Progress Framework for school self-evaluation.

Advising Mongolia's Ministry of Education on its 2030 digital roadmap

Client and partners
Ministry of Education of Mongolia. Funded by UNICEF. The roadmap is led by the Mongolian University of Science and Technology (MUST); Data Delight advises.
Challenge
Mongolia's current digital transition plan ends in 2026. The Ministry needs a costed plan to 2030 built on the UNESCO six-pillar framework, with a baseline, targets, activities, budget, roles and monitoring.
What we did
As international advisors at the kickoff, interim and final stages, we helped shape the scope and wrote an advisory paper with case evidence from ten countries, a six-step budgeting method and a monitoring and evaluation framework, in Mongolian and English.
Status
Kickoff held and advisory paper delivered in October 2026. The final costed roadmap is due in December 2026.

A common language for AI readiness, with Google for Education

Client
Google for Education.
Challenge
Organisations want AI but cannot say where they are. Google's teams needed a way to meet each customer at their actual stage.
What we did
We extended our maturity model with a responsible AI dimension and a ministers' lens, and built it into an interactive tool with radar charts, three-part reports and multi-stakeholder comparison.
Outcome
Presented to Google's Education Solutions Engineering team across Asia Pacific and EMEA in September 2026 and shared across the team.
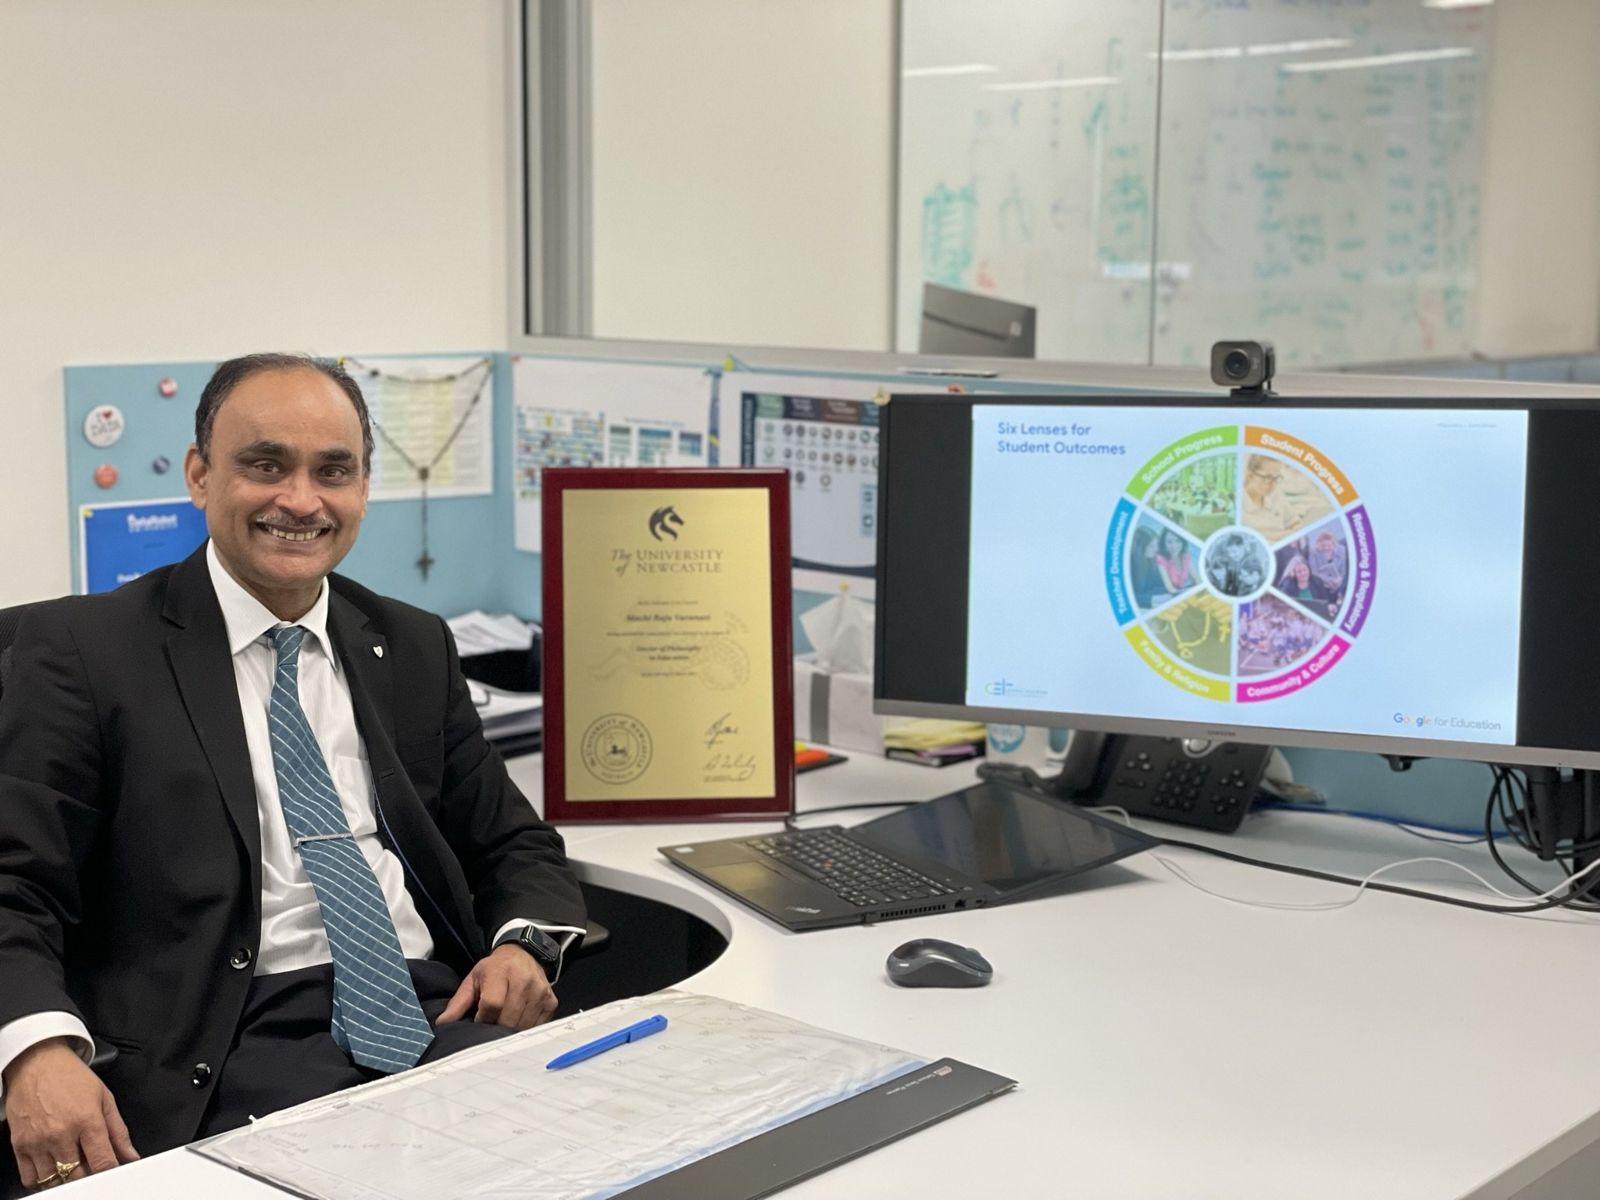
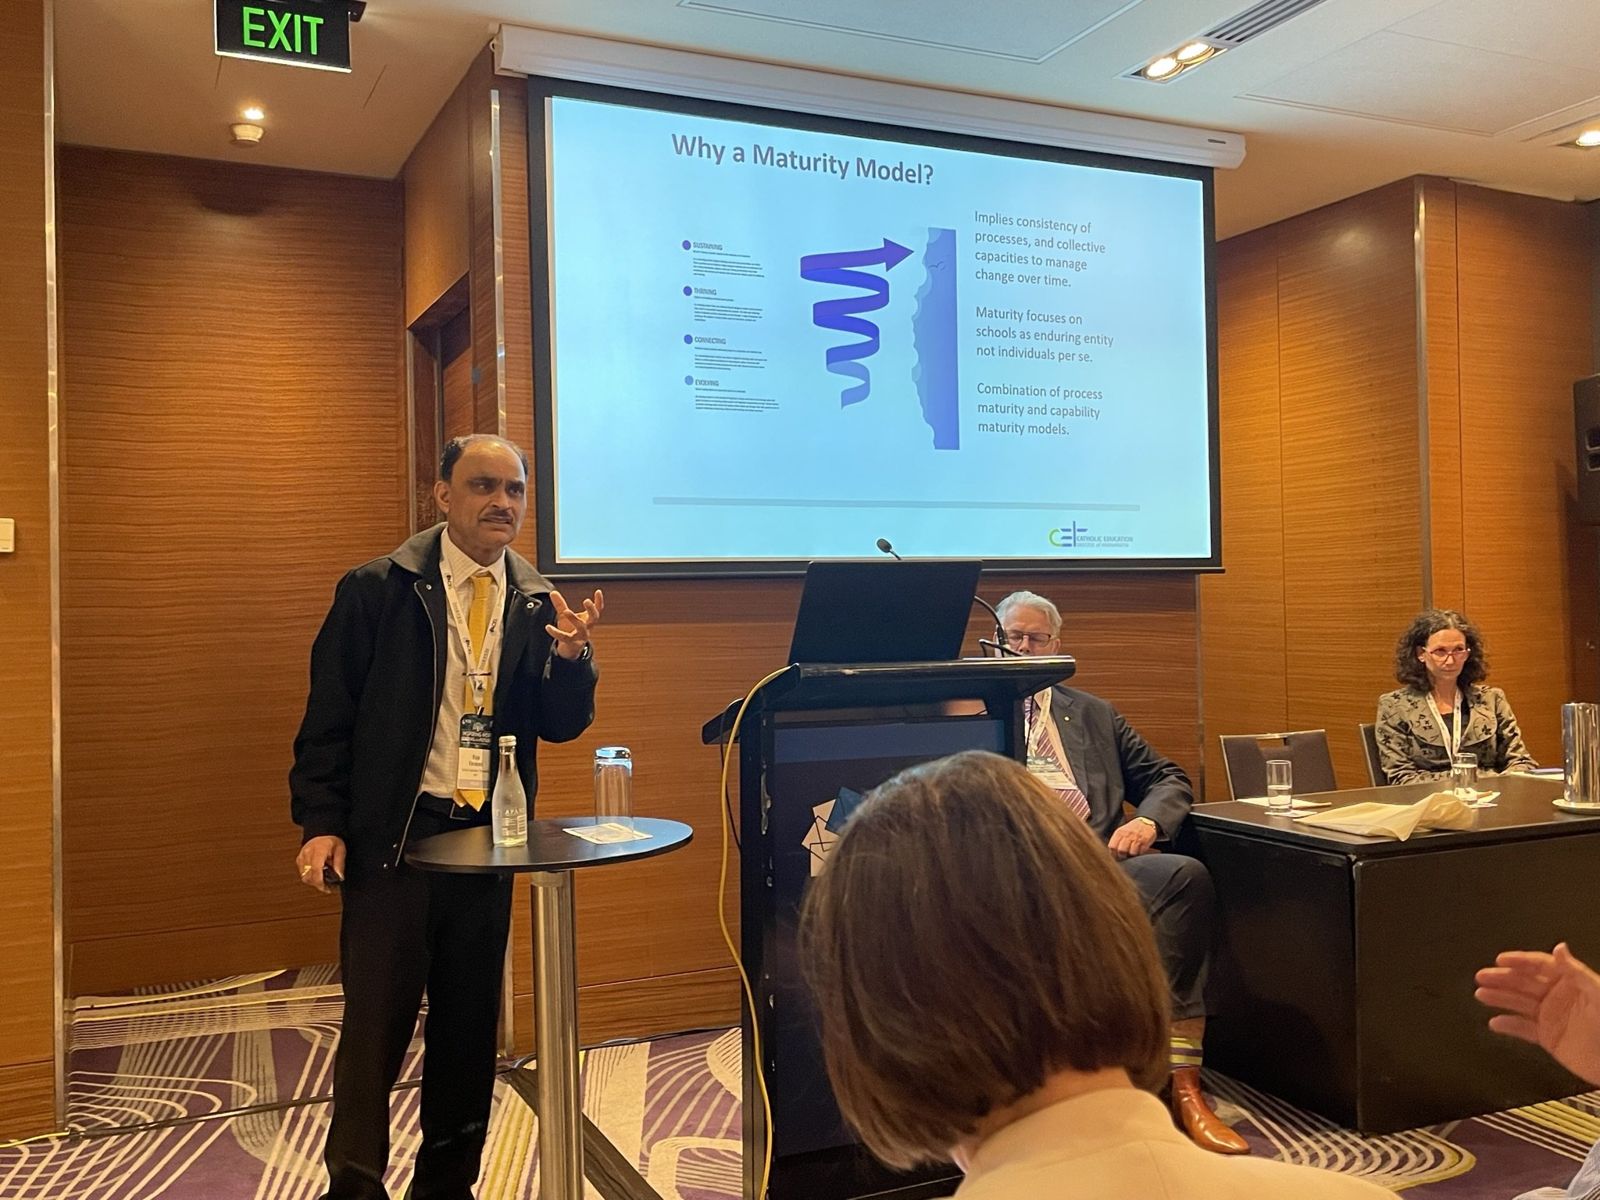
Dr. Raju Varanasi speaking beside a slide titled Why a Maturity Model

From messy records to a school data warehouse

Client
An independent K-12 school in India.
Challenge
Years of inconsistent assessment records, and a school that wanted more than basic dashboards.
What we did
We profiled and cleaned the data, rebuilt it as a data warehouse in BigQuery, designed dashboards for academic leaders and proposed an at-risk prediction model. Student data never left the school's own cloud project.
Outcome
More than 720,000 assessment records unified for over 2,200 students.

AI tutors that cite the syllabus

Context
Prototypes developed with Google for Education's team, 2025 to 2026.
Challenge
Education has little tolerance for AI errors and needs answers that are accountable to the curriculum.
What we did
We built Science Buddy, a science tutor grounded in a knowledge graph of the syllabus, on Google's agent tools and Gemini, plus an offline small-model version for low-connectivity schools, and designed an evaluation grid covering learning, ethics and system quality.
Status
Prototype tested by developers; not yet tested with students.

Insights

Three short articles by Dr. Raju Varanasi.

From reactive reports to proactive success: predicting senior school results

For decades, data in education worked like a post-mortem: scores came in at the end of the year, reports were compiled, and any chance to help a struggling student had already passed.

When I led the data transformation across 80 schools and 43,000 students at the Catholic Education Diocese of Parramatta, my goal was clear: shift from reactive reporting to proactive intervention.

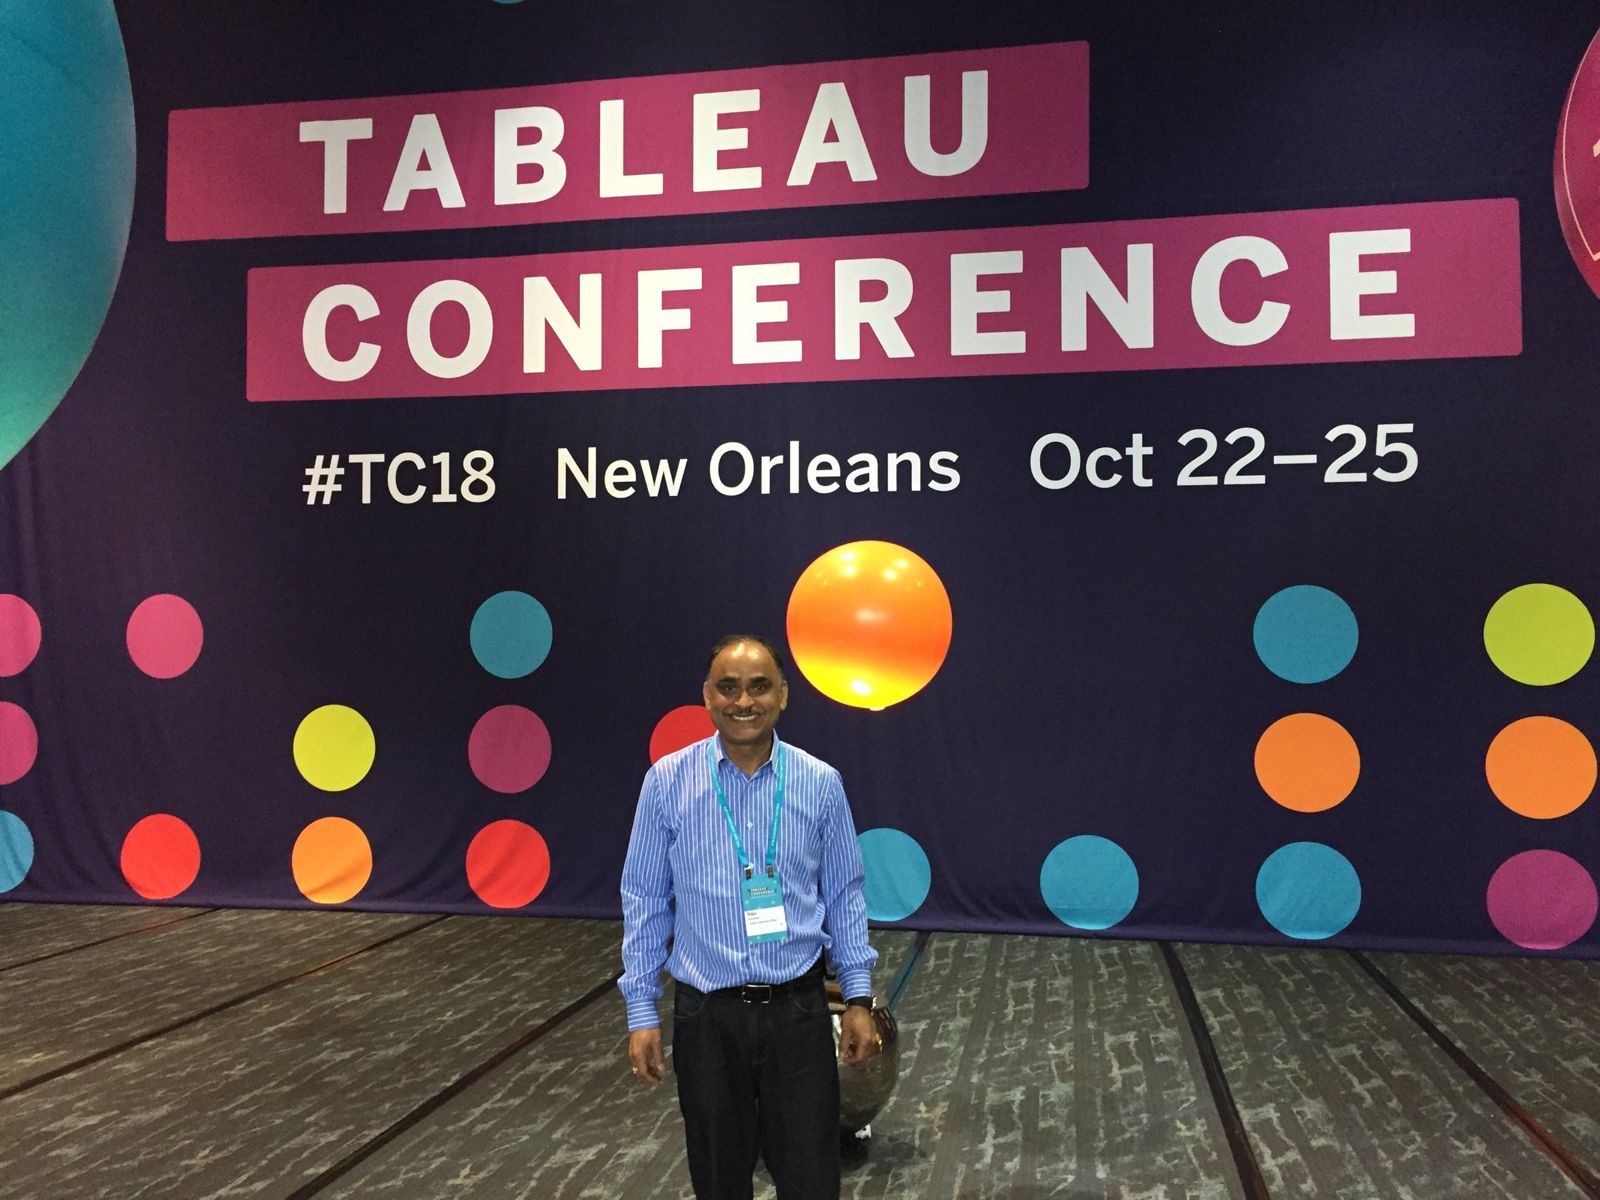
A central data hub. We unlocked 13 years of continuous student data by building an enterprise data hub, with Alteryx for data curation and Tableau for visual analytics.

Insight where it is needed. We delivered 800 visualisations across more than 200 role-based dashboards, giving principals and system leaders immediate insight rather than raw data.

Prediction. Machine learning models using 41 variables, with 26 core influencers, predicted Higher School Certificate results a year in advance with 93% accuracy.

What-if models. Educators and students could see how changing attendance or subject choices would affect future achievement.

Predictive analytics isn't about proving an algorithm right. It is about giving educators and students the gift of time to act before it is too late.

The human side of data: from data-driven to data-informed

Many organisations ask their teams to be "data-driven". But in service professions like education, asking people to work through raw spreadsheets creates friction, not action.

I believe in being data-informed: technical teams manage the data backstage, so the people who use it receive timely, human insight. To bridge the gap, we appointed a dedicated Manager of Data Storytelling to turn complex data into plain-English narratives.

Context over code. Teachers don't need to write queries. They need to know if a student's attendance pattern has quietly shifted over three weeks.

Compassionate analytics. The data once flagged a student who was absent only on Tuesdays. Following it up revealed a student missing sports day because of financial hardship. A quick, caring response got the student back on track.

Building trust. Shifting the focus from "academic performance" to "individual student progress" won over principals and teachers who were sceptical of predictive models.

Data points are digital traces of human behaviour. Behind every metric is a person, and the real measure of a data strategy is how well it improves people's lives.

Leading through crisis: ten days that delivered ten years of technology adoption

When the COVID-19 pandemic hit, schools changed overnight. In the first ten days of remote learning we saw more adoption of digital tools and workflows than in the previous decade.

Rapid adoption brought a new challenge: understanding how students, families and staff were coping in isolation.

Fast communication. Central student information platforms delivered critical updates to more than 900 parents within 24 hours of school closures.

Listening to wellbeing. We added COVID-specific questions on wellbeing, technology and learning to an internationally validated survey (Tell Them From Me) for students, parents and teachers.

Seeing who needed help. Combining session data, app downloads and survey responses helped identify groups experiencing anxiety or isolation, so schools could tailor their support.

Digital transformation without cultural and emotional awareness is incomplete. Real resilience comes from using technology to strengthen connection and trust.

About

Who we are

Our name says what we do: we shed light on data, turning it into insight, and make the result a delight to use, in dashboards, tools and AI applications.

Data Delight (legal name Data-De-Light Pty Ltd) is based in Sydney, Australia. We bring together education leadership, research and hands-on engineering. Our founder, Dr. Raju Varanasi, authors the frameworks; our team turns them into working tools, data platforms and AI prototypes.
How we work

  1. Diagnose. Start from the problem, not the data.

  2. Build. Turn the diagnosis into something people can use: self-assessment tools, dashboards, data models and AI prototypes.

  3. Sequence. A roadmap that moves from trusted data to analytics to governed AI, one stage at a time.

Where we work

Education systems in Australia, Mongolia, Pakistan, India, Singapore, Israel, Kenya, the Philippines and Iceland.

Clients and partners

  • Google for Education
  • Ministry of Education, Mongolia
  • UNICEF Mongolia
  • Mongolian University of Science and Technology
  • Centre for Strategic Education
  • Deakin University

People

Dr. Raju Varanasi

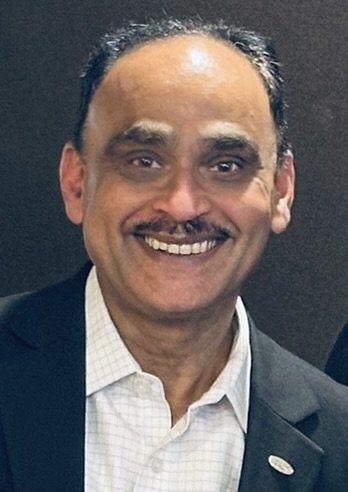
Dr. Raju Varanasi, Founder and Director

Dr. Raju Varanasi is the founder and director of Data Delight and, since January 2024, data and AI consultant to Google for Education. He is a Professor of Practice at Deakin Business School. Before founding Data Delight he led the analytics journey of the Parramatta Catholic school system in Sydney, moving 80 schools and 43,000 students from spreadsheets to more than 200 role-based dashboards for principals and system leaders, with models that predicted senior school results a year ahead. He is the author of the School Progress Framework. He holds a PhD in Education from the University of Newcastle, a management qualification from IIM Bangalore and a B.Tech in Chemical Engineering from IIT Delhi.

Research

Varanasi, R. and Pianta, G. (2023). Harnessing Data for Education Transformation: Parramatta Catholic Schools: A Case Study. Centre for Strategic Education, Victoria. ISBN 978-0-6457476-4-5.

Talks

  • "Data to Decisions: 10 Provocations for Leadership" (2025)
  • "Data Analysis: Mindset for Executives", Deakin executive course (2025)
  • Data and AI maturity session for Google's Education Solutions Engineering team (2026)

Talk to us about where your system stands with data and AI.

Email:
Location:
Sydney, Australia
Email rvaranasi@datadelight.org